R.2 Transparent Making
Providing transparency in environmental, economic, and social processes helps building trust and acceptance of urban manufacturing, while also founding a basis for interaction and collaboration between businesses.
[Context] Increasingly public authorities, industry lobbies, NGOs and the general public are expecting greater levels of transparency in how businesses operate. This could include material sources, waste management data, taxation, employment situations, output levels, environmental impact and so on. For public authorities, transparency could help with decision making. For industry lobbies, transparency could help better understand the needs of their members and how to provide relevant support. For NGOs and the general public, transparency helps making informed decisions about what kind of relationship to have with local manufacturers based on their environmental impact, their economic performance and their general value to society (should their products be prioritised over cheaper imports?). Manufacturers in turn will need to decide how to provide relevant information without losing their intellectual property, exposing themselves to unnecessary public interventions, affecting their community support or endangering their client base.
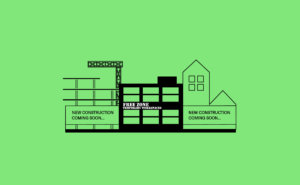
[Problem] For residential neighbours, friction can occur simply due to miscommunication. Residents, particularly new inhabitants in gentrifying areas, may be intolerant to nuisances from manufacturers (from noise, mess, unpleasant odours and dust) and lodge official complaints that create tension with manufacturers. Statistics are also challenging, while cities are increasingly relying on data to make decisions, much of the available data lacks realistic insights into the operations, resource flows, employment conditions, business networks or financial value generated by businesses on a specific site (for example data sets often agglomerate data based on the headquarters rather than the location of production). The well known European statistical system, the NACE codes, provide a useful guide to the variety of manufacturers existing at a national scale but is problematic in providing more granular information. In fact due to the difficult distinction between manufacturing and services, the value of manufacturing can be easily over- or under-accounted. Companies are regularly placed in the wrong category which is particularly problematic for multinational companies or companies that change activity. Several other aspects of urban manufacturing are lacking available data including information on freelance workers, actual workplace locations or small and medium-sized locations.
[Forces] Public authorities often acknowledge their lack of awareness of the complexity driving their local economy. Tension can arise between those actors with a metropolitan scale view that depend on available aggregated data and actors that have a tangible sense of the day to day challenges facing businesses. These two perspectives often struggle to see eye to eye. Costs for local or regional authorities to acquire realistic and reliable data and knowledge can be prohibitive. For issues such as resource flows, even companies generally have poor records which means that no one has a realistic view of what moves in and out of production process (see R.12 Material Database). Furthermore businesses are apprehensive to risk infringement of privacy or exposure to competition if their practices or commercial data becomes public. Conversely, few businesses have the habit of investing in public communication campaigns to build trust and transparency with their local marketplace or community unless it plays an essential part in their business model.
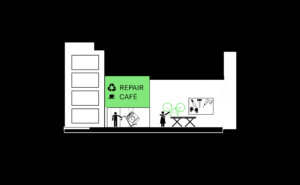
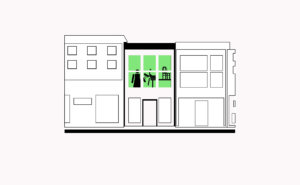
[Solutions] To improve the legitimacy between local clients and manufacturers, find both statistical data and factual information that can help clients, public authorities and neighbours to make informed decisions. As conventional statistics rarely provide a realistic insight into how business operate, a comprehensive list of economic and socio-spatial indicators should be built and sourced locally. This will require both qualitative and quantitative data collection of what happens on the specific site. This can start with an annual door-knocking survey and evolve into a more comprehensive (digital) accountancy tool. For example a R.12 Material Database can help create insights into resource flows. Friction between manufacturers and their neighbouring housing areas can simply involve improving communications which can avoid social and financial policing costs. To support the use of public databases, R.11 Incentives for Research & Development could be mobilised. Public institutions can encourage businesses to build more open façades (B.3 Public Face) to make them more accessible, encourage businesses to run tours and support the development of a P.8 Community Hub in Making Locations to act as a bridge between makers and the larger community. Companies can provide more transparency by investing in communications campaigns, R.1 Making Making Visible. For businesses in mixed neighbourhoods, assigning a responsible staff member responsible for community relations liaison can avoid conflicts while potentially stimulating tourism. In industrial neighbourhoods this could be managed by the R.3 Curator.
[Contribution] Add contributions here.